Instruction

To view a guide for a specific block, click on it in the image. Please note that the Contracts indicator block is currently not displayed


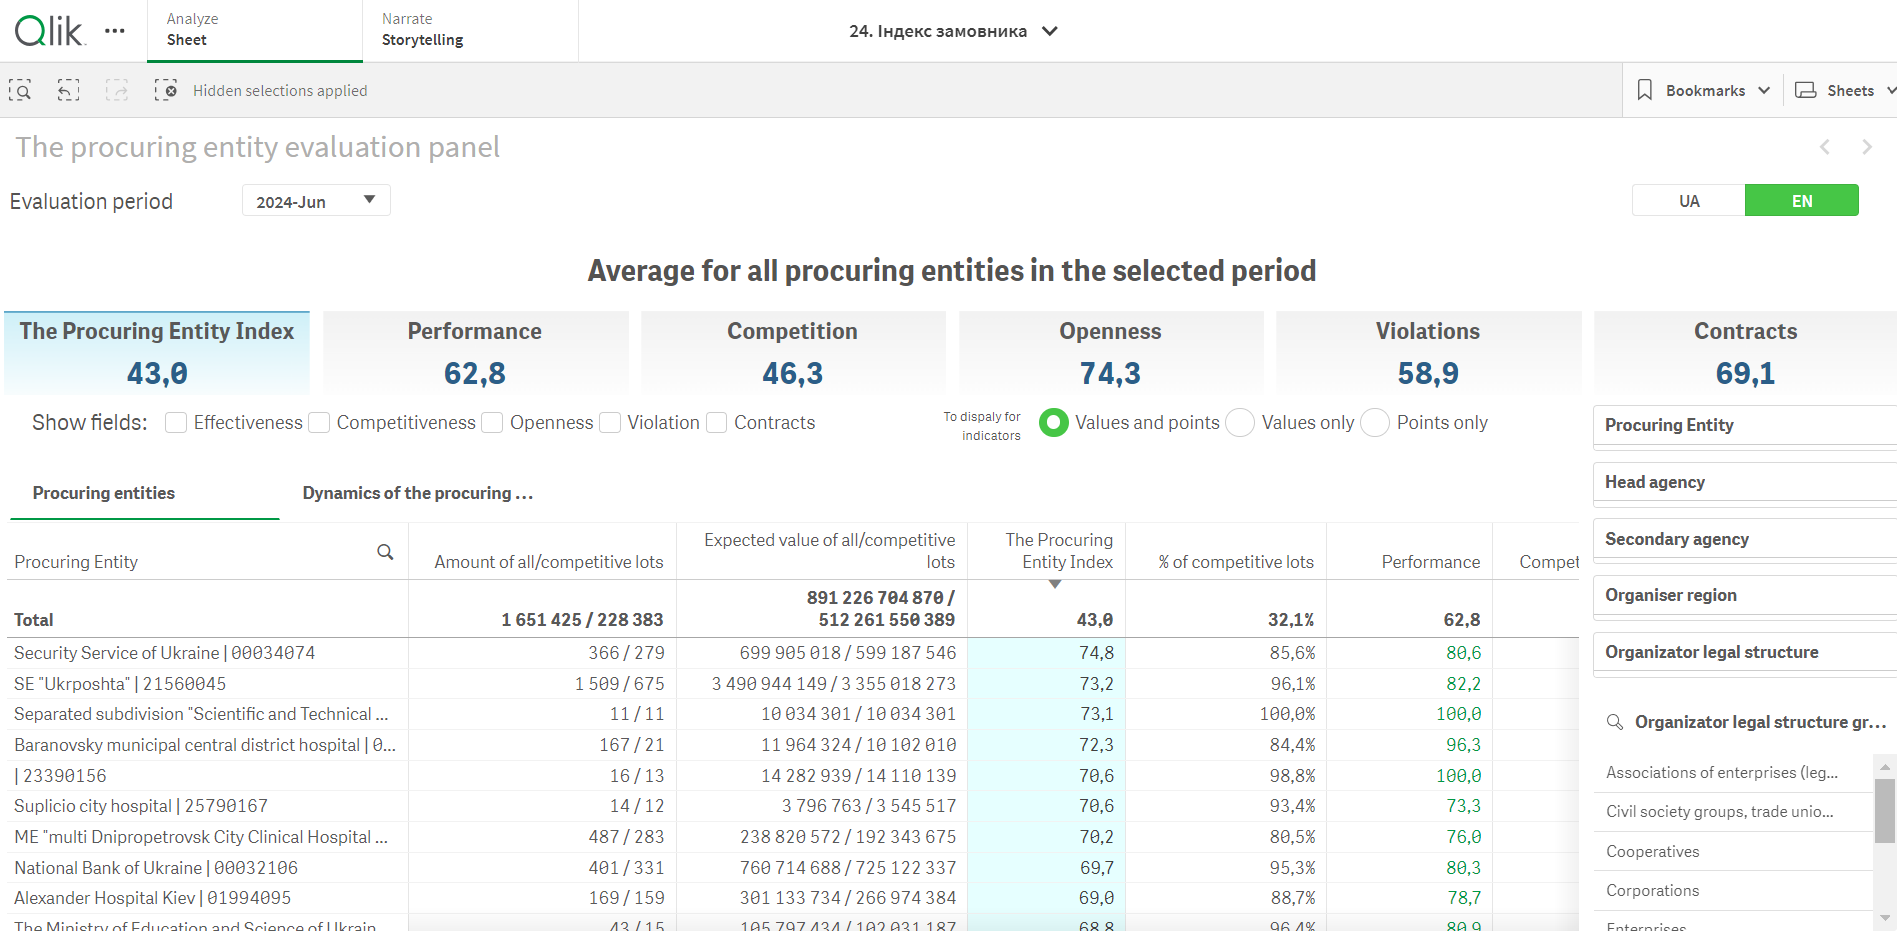
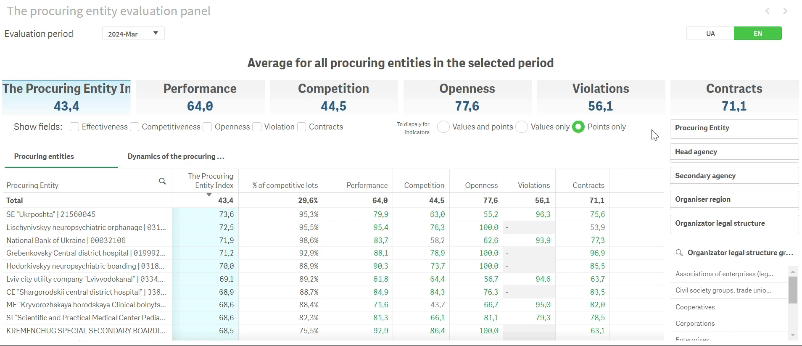
A button to select the procuring entity evaluation period.
Periods are reflected by accumulation since the beginning of the year. For example, the selected period “March 2024” will include January–March 2024, and the period “December 2023” will include January–December 2023.
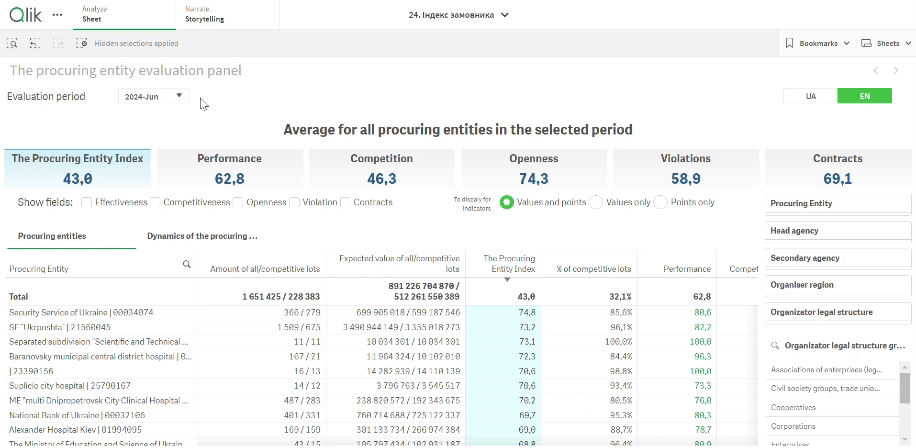
Main results panel.
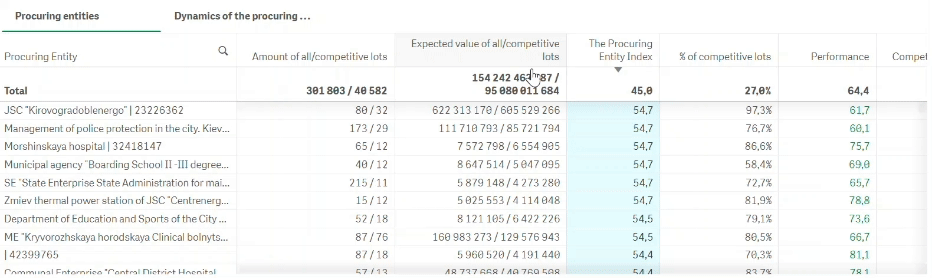
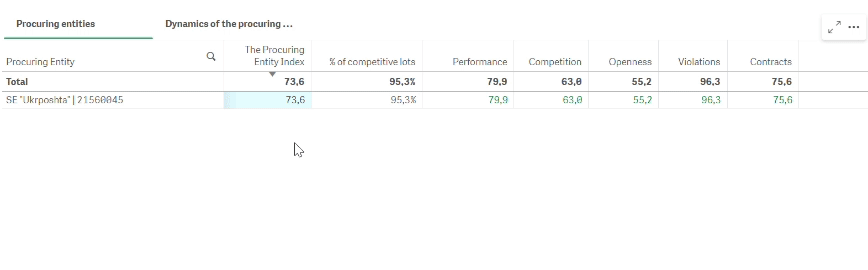
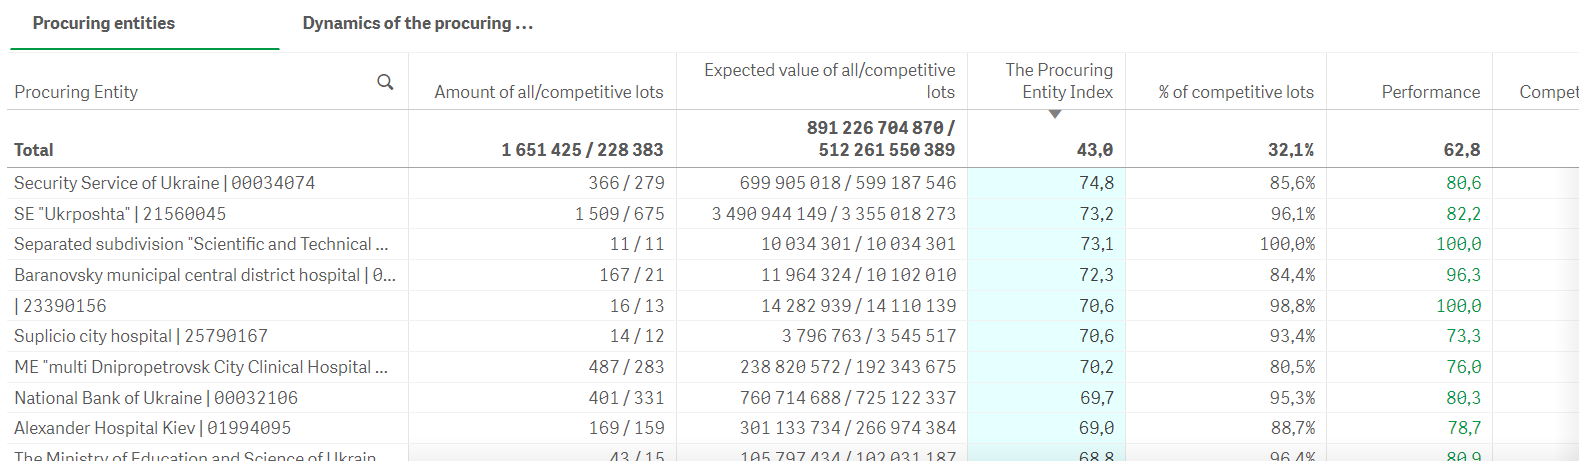
This is a panel that displays the procuring entities in your sample and their indicators. The data can be sorted by increasing or decreasing by clicking on the column header. The results can be downloaded in Excel format. To do this, right-click on the panel and select “Table,” “Download as,” and “Data.”
Average of all organizers on Prozorro in the selected period.

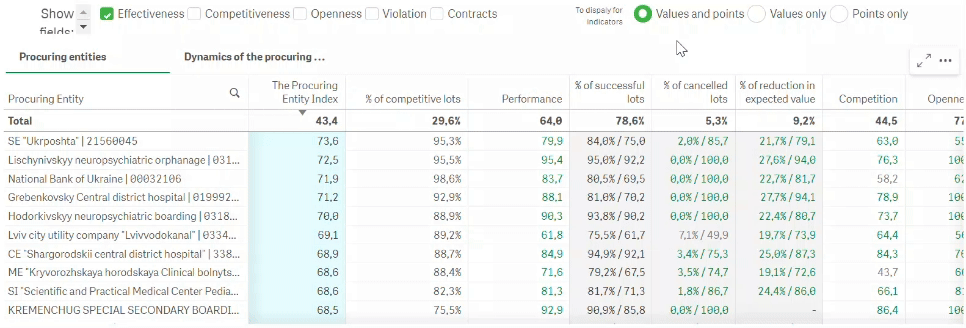
Indicator blocks field.
If you check the box next to the name of the indicator block, the main results panel will display the results for all indicators that are included in it. For example, if you check the box next to “Performance,” the “% of successful lots,” “% cancelled lots,” and “% decrease in expected cost (savings)” columns will appear in the main results panel. This way, the user can independently choose the level of report detail.
The score for a block of indicators is calculated as the average score for each of the indicators included in this block (a detailed list is provided in the methodology).
The indicators included in each block have a gray background color, and the main indicator of the block is white. This is how the blocks of indicators and the indicators that are included in them are visually different.
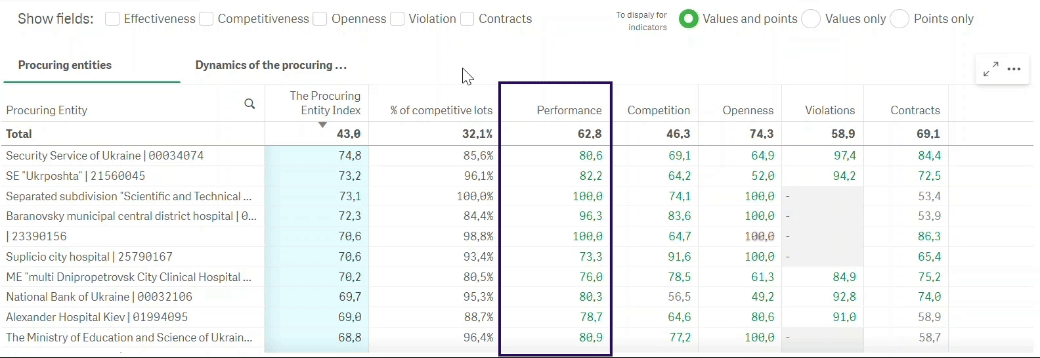
If the procuring entity does not have a result for the indicators within the block of indicators, then the “-” is displayed, and such a block is not considered during the final calculation of the Procuring Entity Index.
Toggle display of results by indicators.
If the value by indicator blocks (effective value) is displayed only in scores, the indicators within the block are displayed both in scores and in actual values. The user can customize the display: “scores only,” “values only,” “both values and scores.”
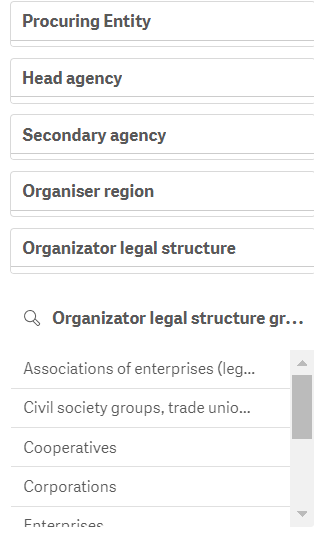
Selection panel.
Allows selecting a procuring entity or a group of procuring entities according to the hierarchy (by secondary or main body), the region of the organizer, and the organizational and legal form of the organizer.
It is also possible to select a specific procuring entity or their group by EDRPOU code. To do this, enter their codes in the “Organizer” field with a space:
Dynamics of the organizers.
Toggles the main results panel to display the selected procuring entity's performance over the last two calendar years. This way, you can analyze the procuring entity's trends in more detail, for example, whether their results are improving or worsening or whether there is a seasonal dependence. The data are displayed in graph format. But visualization functions exclusively if you select ONE procuring entity.
On the right, you can choose which data of the procuring entity are displayed: blocks of indicators or the indicators themselves within the selected block.